AI CHART ANALYSIS FOR GOLD TRADERS
Your chart.
A clearer
plan.
Upload your gold chart. Asterra AI Analyzer gives you a BUY, SELL, or WAIT assessment—with the reasoning and trade levels when a setup qualifies.
$0 for 1 day. Then $59 USD/month.
Auto-renews. Cancel before your trial ends to avoid a charge.
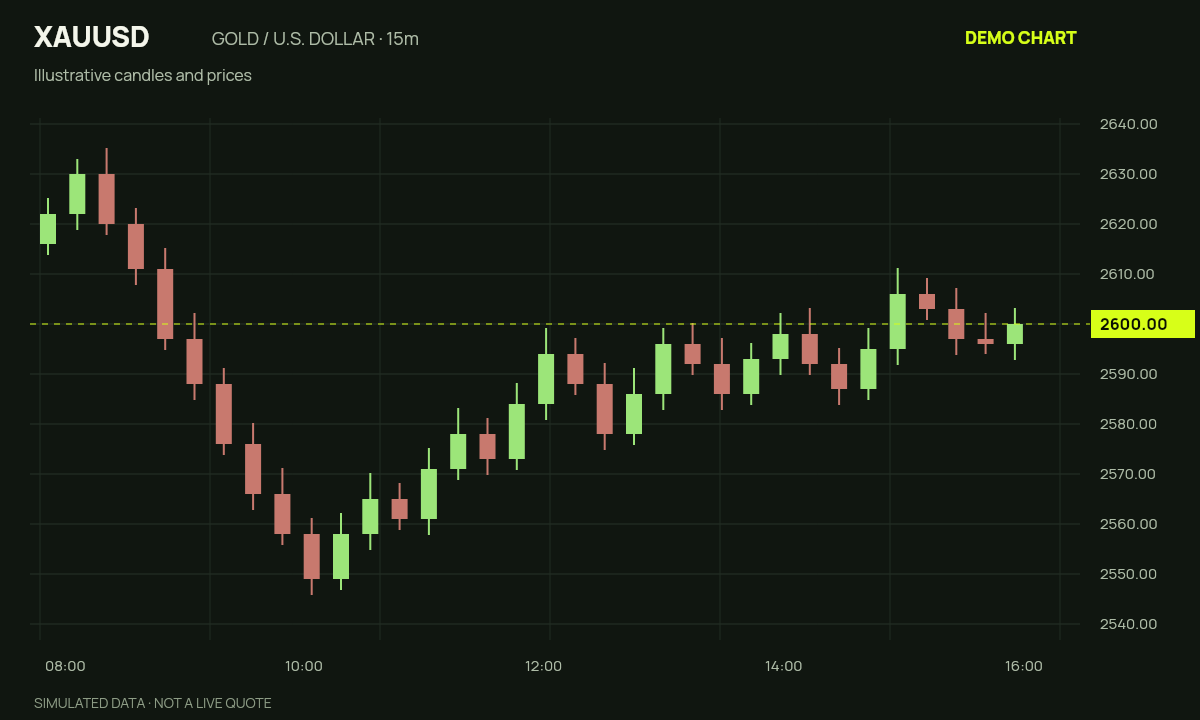
See the setup. Review the reasoning.
You decide what happens next.
Simplified sample display. Illustrative prices, not a live trading signal.
More context.
XAUUSD / GOLD
BUY · SELL · WAIT
YOUR DECISION, ALWAYS
FROM SCREENSHOT TO ASSESSMENT
Three steps.
A lot more context.
You already have a chart. Give yourself a structured way to review it before your next decision.
- 01
Upload your chart.
Use a screenshot or take a photo. Keep the gold symbol, timeframe, candles, and price scale visible.
JPG, PNG, or WebP - 02
Let AI assess it.
The Analyzer checks the visible structure, confirmation, and levels. Analysis can take up to a minute.
Built for XAUUSD - 03
Review the next step.
Inspect the result, its reasoning, and what would invalidate it. Confirm the details on your trading platform.
No orders placed automatically
SEE THE ACTUAL PRODUCT
From “what am I seeing?”
to “here’s what to review.”
Follow one sample gold chart through the real member interface. Upload. Analyze. Review.
Actual interface. Simulated chart and assessment. No trading outcome is shown.
Read the demo transcript
Meet Asterra AI Analyzer. Here is a simulated gold-chart example. Upload a clear chart, or take a photo. Keep the symbol, timeframe, and price scale visible. Tap Analyze chart. The analyzer checks the setup, confirmation, and trade levels. In this demo, the result is BUY, based on a break and retest. The sample entry is 2,600; stop loss is 2,590; targets are 2,620 and 2,630. The first target offers two-to-one reward to risk. Review the reasoning and invalidation. Confirm prices on your trading platform. No trade is placed automatically. Available to members, including your active 24-hour free trial. Upload. Analyze. Review.
LOOK BEYOND THE SIGNAL
The result is just the start.
The reasoning matters.
A qualifying setup comes with estimated levels. When the evidence is incomplete, the result is WAIT. Explore both examples.
A good image shows the symbol, timeframe, candles, and price scale.
Read the “why.”
The assessment explains the visible evidence and what would make the setup invalid. You can check the logic for yourself.
In this walkthrough example, price breaks resistance, retests the level, and closes with bullish confirmation.
- Entry
- 2,600.00
- Stop loss
- 2,590.00
- Take profit 1
- 2,620.00
- Take profit 2
- 2,630.00
TP1 reward / risk 2:1Before spread, fees, and slippage
What the chart shows
- Higher lows support the upward move.
- Resistance is retested as support.
- A bullish candle closes after the retest.
InvalidationIn this example, the setup fails below the retest low at 2,590.
Examples use simulated charts. Prices are illustrative. No live market signal is being issued.
Try it with your own chartA SECOND LOOK. YOUR FINAL CALL.
Useful analysis.
Without handing over control.
The Analyzer reads the image you provide. It does not connect to your broker, place orders, or watch the market for you.
Use its assessment as another input to your process. Check prices, spreads, and news before deciding whether a trade makes sense.
A few things to knowTHE ANALYZER IS INCLUDED IN ASTERRA
Start with AI Analyzer.
Get the whole toolkit.
Your trial includes the Analyzer and the member resources around it. Start with one chart, then explore the rest at your own pace.
- 01AI AnalyzerTHE MAIN EVENT
Gold-chart assessments with reasoning.
- 02Gold EA + chart indicators
Trial bot for MT5 and two TradingView indicators.
- 03Signals, guides & support
More tools and help inside your member portal.
Then $59 USD/month
Try AI Analyzer freePayment details required. Auto-renews after one day. Cancel before the trial ends to avoid the first charge.
AI usage limits apply. Gold EA trial uses the Free Trial version. TradingView access requires approval.
What can I upload?
A clear screenshot or photo of an XAUUSD / gold-in-USD chart. Show the symbol, timeframe, candles, and price scale. JPG, PNG, and WebP files up to 20 MB are supported. A recent M15 or H1 chart is a useful starting point.
Can I use it on my phone?
Yes. Open the member portal in your browser and upload a screenshot or take a chart photo. The Analyzer itself does not require an MT5 installation. The optional Gold EA is a separate tool with its own setup requirements.
What does BUY, SELL, or WAIT mean?
BUY and SELL are chart assessments that include estimated entry, stop-loss, and target levels when the product’s checks pass. WAIT means there is no qualifying setup or enough readable evidence; it does not issue trade levels. These results can be wrong and are not promises of profit.
Is the Analyzer included in the free trial?
Yes. It is available during your active one-day trial and with an active membership. AI usage limits apply; this is not an unlimited-analysis offer. After the trial, membership renews at $59 USD/month unless canceled before the trial ends. Trial eligibility and final terms appear in checkout.
Does it use live prices or place trades?
No. It reads the screenshot you provide. It does not use a live price feed, check current news, access your broker, or execute trades. Confirm estimated levels on your platform and make your own decision.
What happens to my chart image?
Your image is sent to OpenAI for analysis. Asterra does not save the uploaded image or the analysis result. Avoid including account numbers, balances, or other private details in your screenshot.
How do I get access or cancel?
Complete the Stripe-powered checkout and open the portal invite sent to your checkout email. After signing in, choose AI Analyzer in the member menu. Manage or cancel your Asterra membership from Account in the members portal. Cancel before your trial ends to avoid the first charge.
BRING YOUR CHART. GET MORE CONTEXT.
See your next chart
with a second set of eyes.
Try AI Analyzer free $0 for 1 day. Then $59 USD/month.
Auto-renews. Cancel before your trial ends to avoid a charge.